Step Plots
|
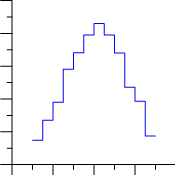
Click the Home | New Graph | Line/Scatter | Step Plot command to create a step plot. Step plots are very similar to line/scatter plots. In line/scatter plots, the connecting line is drawn directly between adjacent points using the shortest path. In a step plot, the connecting lines are always drawn parallel or perpendicular to the axes. Click the Step Plot button to create the step plot. |

|

|
| Step plots draw data connecting lines as parallel or perpendicular to an axis. |
To understand how this line is created, imagine drawing a horizontal line through each data point, then go back and draw a vertical line through each data point. The intersecting lines would form the step plot. Of course, you could also start by drawing the vertical lines first, which creates a different step path. Grapher makes it easy to create plots with either horizontal or vertical step lines.
Creating a New Step Plot
To create a step plot:
- Select Graphs | Create | Basic | Step Plot command.
- Select a data file in the Open Worksheet dialog. You can select a new data file or you can select an open data file in the Open worksheets section.
- Click the Open button. A step plot is created using the default properties.
Editing Step Plot Properties
To change the features of a step plot— including the columns used to create the plot— first select the plot in the plot window or Object Manager and then edit its properties in the Property Manager.
Click the following tabs in the Property Manager to change different properties: