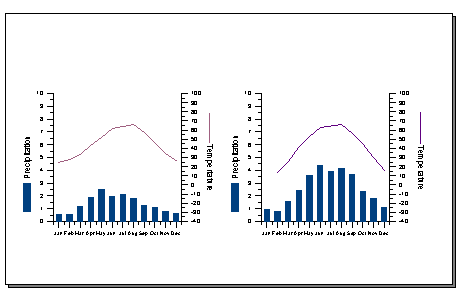
Creating Multiple Graphs on a Page
There are several ways to create more than one graph on a page. The easiest method is to use the mouse, although you can edit the axis properties when creating multiple graphs on a page.
To create multiple graphs on a page:
- Create the first graph.
- Select the entire graph.
- Drag the graph to a new position using the mouse.
- Create the second graph.
- Select the entire second graph.
- Drag the graph to a new position using the mouse.
The graph can also be moved and sized using the axis properties.

To create graphs similar to the one shown above on Legal size paper:
- Create the first graph.
- Edit the axis properties. In the left graph, the length and starting positions were set as follows:
- Y Axis 1 (left): Length 4.00 inches, X Position 1.50 inches, Y Position 2.00 inches
- X Axis 1 (bottom): Length 4.00 inches, X Position 1.50 inches, Y Position 2.00 inches
- Y Axis 2 (right): Length 4.00 inches, X Position 5.50 inches, Y Position 2.00 inches
- Create the second graph.
- Edit the axis properties. In the right graph, the length and starting positions were set as follows:
- Y Axis 1 (left): Length 4.00 inches, X Position 8.00 inches, Y Position 2.00
- X Axis 1 (bottom): Length 4.00 inches, X Position 8.00 inches, Y Position 2.00 inches
- Y Axis 2 (right): Length 4.00 inches, X Position 12.00 inches, Y Position 2.00 inches