Bubble Plots
|
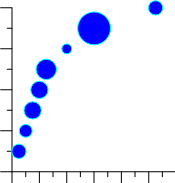
Click the Home | New Graph | Class/Bubble | Bubble Plot command to display two variables on a scatter-type plot. In a 2D bubble plot, the diameter of each bubble can vary in size, providing a way to represent an additional dimension of data. For example, consider a traditional scatter plot that shows the number of new automobile sales in the U.S. over a period of time. Using a 2D bubble plot, you could also display a third dimension of data that shows the average U.S. household income over the same time span. Click the Bubble Plot button to create the bubble plot. |
|

|
| Bubble plots show X, Y, and Z variables. The Z variable is displayed as the bubble size. |
Creating a New Bubble Plot
To create a bubble plot:
- Click the Home | New Graph | Class/Bubble | Bubble Plot command.
- Select a data file in the Open Worksheet dialog. You can select a new data file or you can select an open data file in the Open worksheets section.
- Click the Open button. A bubble plot is created using the default properties.
Editing Bubble Plot Properties
To change the features of a bubble plot— including the columns used to create the plot— first select the bubble plot in the plot window or Object Manager and then edit its properties in the Property Manager.
Click the following tabs in the Property Manager to change different properties:
