High-Low-Close Plots
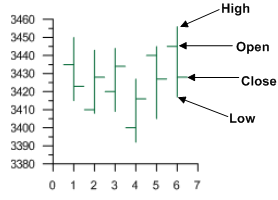
Click the Home | New Graph | Specialty | High-Low-Close Plot or Home | New Graph | Specialty | High-Low-Close Candlestick Plot command to display a range of Y values at each X value. This plot is commonly used to display the daily high, low, opening, and closing stock values, although it can be used for other data types. A vertical line is drawn between the high and low values, and horizontal lines show the opening and closing values. The opening value is a horizontal line to the left of the hi-low vertical line, and the closing value is a horizontal line to the right of the hi-low vertical line. Opening and closing values are optional. The high values must be greater than the low values. Hi-low-close plots may also be drawn as "candlestick" plots where a box is drawn between the opening and closing values.


Click the High-Low-Close Plot or High-Low-Close Candlestick Plot buttons to create high-low-close plots.


Hi-low-close plots show four
variables, typically stock values.

Creating a New High-Low-Close Plot

To create a high-low-close plot:

  1. Click the Home | New Graph | High-Low-Close Plot or Home | New Graph | High-Low-Close Candlestick Plot command
  2. Select a data file in the Open Worksheet dialog. You can select a new data file or you can select an open data file in the Open worksheets section.
  3. Click the Open button. A high-low-close plot or high-low-close candlestick plot is created using the default properties.

Editing High-Low-Close Plot Properties

To change the features of a high-low-close plot, including the columns used to create the graph, select the high-low-close plot in the plot window or Object Manager and then edit its properties in the Property Manager.

Click the following tabs in the Property Manager to change different properties:

Plot

Data Limits

Labels

Line

Fill

See Also

Standard Axes

Add Additional Axes

Add Plots

Duplicate Axes

Legends

Multi-Graph Legends

Graph Title

Creating Multiple Graphs on a Page

List Worksheets

Graph Wizard