Box Plot Axes
Box plot axes appear on box plots and notched box-whisker plots. Box plot axes contain the category value for each column in the worksheet. Box plot axes are X axes for vertical box plots and Y axes for horizontal box plots. The labels are the column header labels.
Box plot axes are created automatically when the box plot or notched box plot is created. Box plot axes cannot be added to an existing graph.
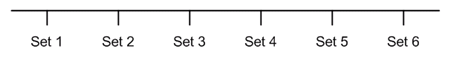
An example box axis shows a set from each column. The set
names are from the column headers.
Editing an Existing Box Plot Axis
To change the features of a box plot axis, click once on the axis in either the plot window or the Object Manager to select it. The properties of the selected axis are displayed in the Property Manager.
Multiple axes can be selected and edited at once. To select multiple axes, click on the first axis to select it. Hold down the CTRL key and click on the second axis In the Object Manager.
Click the following tabs in the Property Manager to change different properties: