Polar Wind Charts
|
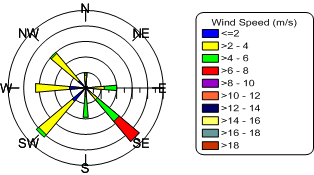
Click the Home | New Graph | Polar | Polar Wind Chart command to display wind data, although you can use this graph type with other types of data. In a wind chart, each bin represents the number of times wind flows from a given direction. The direction is divided up into bins, and each bin contains separation of the data into wind speeds. Therefore, the number of times wind comes from a given direction and the speed of the wind is given in each bin. Click the Polar Wind Chart button to create a polar wind chart. |
|

|
| Wind charts show data grouped into bins and then categorized within each bin. |
Creating a New Polar Wind Chart
To create a wind chart:
- Click the Home | New Graph | Polar | Polar Wind Chart command.
- Select a data file in the Open Worksheet dialog. You can select a new data file or you can select an open data file in the Open worksheets section.
- Click the Open button. A wind chart is created using the default properties.
Editing Polar Wind Chart Properties
To change the features of a wind chart, including the columns used to create the chart and defining data limits, first select the chart in the plot window or Object Manager and then edit its properties in the Property Manager.
Click the following tabs in the Property Manager to change different properties:
