Changing the Tick Labels
Tick labels can be displayed using different label sources including Automatic, Date/Time, and From worksheet. Automatic labels are the default, however there may be situations where either using either a number to represent date/time values or labels directly from a worksheet source may be useful. For this tutorial, we will change the X Axis labels to use a data column from the worksheet where we have tick label names specified. To change the tick labels source:
-
Click on the X Axis 1 in the Object Manager to select it.
-
In the Property Manager, click on the Labels tab to open the tick label properties.
-
Click the word Automatic next to the Label source option and select From worksheet in the list. This displays the Worksheet properties in the Labels page.
-
Next to Worksheet, click the word None to display a list of open worksheets and the Browse option. The Browse option would be used to select a worksheet that is not already open. In this tutorial, the worksheet we want to use is already open. Select the Tutorial.xlsx file from the list (or Tutorial.dat if you are using the sample file).
-
Next to the Data variable property, click the current column and select Column A: Month.
-
Next to the Label variable property, click the current column and select Column J: Month Name.
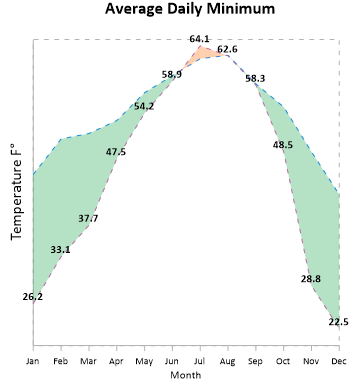
The graph updates with the worksheet labels defined by the text in Column J of the worksheet.

|
|
You can customize tick labels to display values from a column in the worksheet. |
If the axis labels or the axis title overlap or need to be moved slightly, the Graph Tools | Plot Tools | Move Labels command can be used to move the axis labels just as the plot labels were moved earlier in the tutorial.
Back to Changing the Tick Mark Spacing
Next to Adding a Secondary Linked Axis