Options - Defaults
You can set defaults such as file open/save paths, page units, undo
levels, through the File | Options
command. In the Options dialog,
click the ![]() button next to Defaults to expand
the Defaults section to access
these items. Changes made in the Options
dialog affect all subsequent documents. Existing documents and settings
are not changed.
button next to Defaults to expand
the Defaults section to access
these items. Changes made in the Options
dialog affect all subsequent documents. Existing documents and settings
are not changed.
Default settings for specific object types, such as line/scatter plots, rectangles, or legends can be set with the File | Defaults command.
The Defaults section has the following sub-sections: Line, Fill, Symbol, Font, and Digitize Format.
Line
Click Line on the left side of the dialog to display the Line Properties on the right side of the dialog. Use the Line Properties to set the default Line Properties.
Fill
Click Fill on the left side of the dialog to display the Fill Properties on the right side of the dialog. Use the Fill Properties to set the default Fill Properties.
Symbol
Click Symbol on the left side of the dialog to display the Symbol Properties on the right side of the dialog. Use the Symbol Properties to set the default Symbol Properties.
Font
Click Font on the left side of the dialog to display the Font Properties on the right side of the dialog. Use the Font Properties to set the default Font Properties.
Digitize Format
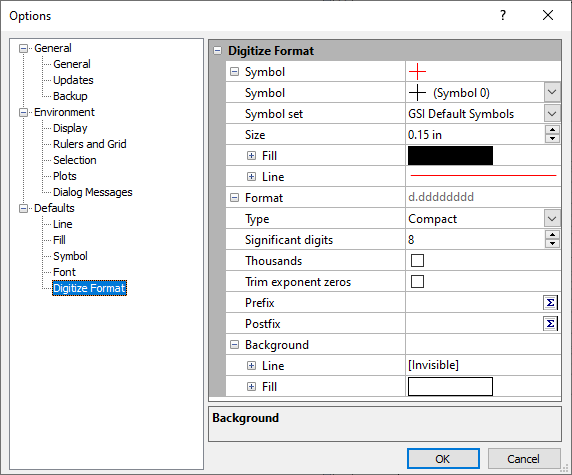
Click Digitize Format on the left side of the dialog to display the Digitize Format options on the right side of the dialog. Use the Digitize Format options to set the symbol properties and numeric and label format for digitizing.
|
|
|
Grapher Digitize Format options |
Changing the Digitizing Symbol
To change the digitizing symbol:
-
Click the File | Options command.
-
In the Options dialog, click on Digitize Format on the left side of the dialog.
-
On the right side of the dialog, click the
 next
to Symbol.
 -
Select the Symbol by clicking on the existing symbol and selecting the desired symbol from the list.
-
Change the symbol size, color, or other symbol properties if desired.
-
Click OK to return to the plot window.
-
Click on the plot and click the Graphs | Digitizing | Digitize command.
-
Click on the screen and the new symbol will be displayed.
