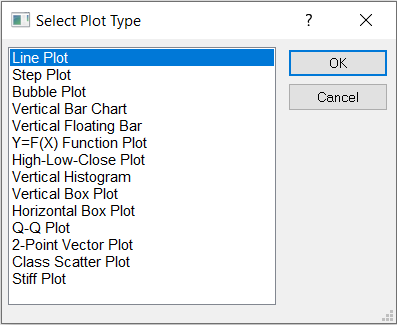
Select Plot Type - Add Plot
Use the Select Plot Type dialog to select the type of plot to add to an existing graph. Select any part of the graph and right-click on it, choose Add Plot and select a plot type from the Select Plot Type dialog.

Select a plot type to add in
the Select Plot Type dialog.
Plot List
Select a plot type from the list of available plots. The list is limited by the original graph type. For example, when adding a plot to a polar graph, polar functions, rose diagrams, wind charts, and other polar plots can be added.
OK or Cancel
Click the OK button to close the dialog and save your changes. Click the Cancel button to close the dialog without saving your changes.