Bar Chart Multiple Variable Data Files
Multiple variable bar charts can be created from a single data file or from different data files. Typically, the X values (for vertical bars) are the same for each of the bar charts. However, the X values may be different between bar charts.
When creating stacked bar charts, each row of data is considered a stack. When creating adjacent bar charts, each row of data is plotted around the same X value. The same X value should not be repeated in multiple rows. If so, the bars will overwrite each other. Check for duplicate values in the X column by determining if there is a Mode with the Data Tools | Data | Statistics command.
Multi-variate Bar Charts from One Data File
Using the data from this example, create a new worksheet within Grapher.
|
X |
Bar 1 |
Bar 2 |
Bar 3 |
Total |
|
11 |
10 |
15 |
6 |
31 |
|
12 |
10 |
7 |
6 |
23 |
|
13 |
6 |
12 |
8 |
26 |
|
14 |
2 |
8 |
7 |
17 |
There is one X column and three data columns. The Total column is optional and does not have to be included in the plot.
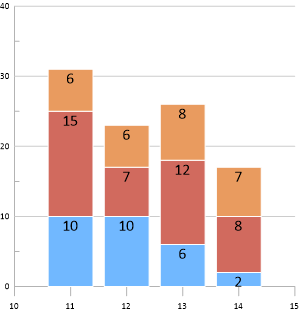
When creating a stacked bar chart, row 1 is plotted at X = 11 and Y reaches 31, row 2 is plotted at X = 12 and Y reaches 23, etc.
|
|
|
|
Stacked bar charts plot bars on top of one another in the order specified in the Object Manager. |
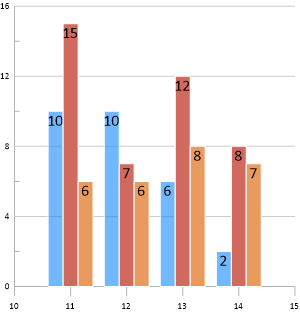
Adjacent bar charts group bars around their X values. The bar chart order is determined by the plot order in the Object Manager. |
The fastest method to create a graph with multiple plots is to use the Graph Wizard. However, to create the bar chart shown above from a single data file using the ribbon commands:
- Highlight Columns A - D from the data in the new worksheet you created in Grapher.
- Click the Home | New Graph | Bar | Vertical Bar Chart command. The default plot is the stacked bar chart.
- Select one of the newly created bar charts in the Object Manager.
- In the Property Manager click on the Plot page to change the properties of the plot.
It is easy to create multi-variate bar charts when the variables are all in a single data file.
Multi-variate Bar Charts from Multiple Data Files
The charts presented above can also be created from multiple data files. Notice the X values are repeated in each file.
|
|
|
||||||||||||||||||||||||||||||||
|
Data file 1 |
|
Data file 2 |
|
Data file 3 |
When bar charts are created from different data files, the Bar Groups page in the Property Manager is used to create bar chart groups.
Using the data from this example, create three separate files and save them as BarChart1, BarChart2, and BarChart3.
- Click the Home | New Graph | Bar | Vertical Bar Chart command.
- Select the BarChart1 file from the Open Worksheet dialog and click Open.
- Select the bar chart in the Object Manager.
- Click the Graph Tools | Add to Graph | Plot command and select Bar Chart - Vertical from the list.
- Click OK in the Choose Axes dialog.
- Select the BarChart2 file and click Open. The data from BarChart2 is stacked on top of BarChart1.
- Repeat steps 3 through 6 for the BarChart3 file.
- Click the Bar Groups page in the Property Manager.
- In the Bar Charts section click the
 and select New Group to create Group 1.
- Assign all of the bar charts to Group 1. Now that all bar charts are in Group 1, the bars appear stacked correctly.
- Change the fill color for Bar Chart 2 and Bar Chart 3 by selecting each plot and changing the properties on the Fill tab.
Plots from different data files can be combined in a single graph by taking the extra steps illustrated above.

