Math Plot
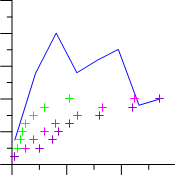
Click the Graph Tools | Add to Graph | Math Plot command to create a math plot. A math plot is a plot with Y values calculated from a mathematical function with existing plots. By default, a summation plot is created, where the Y values of selected line/scatter and function plots are added together to get the math plot values. All plots must be on the same graph for creation of a math plot; however, they can use different axes and X values.

|
|---|
|
Math plots are used to create new plots from existing columns without modifying the worksheet. |
Creating a New Math Plot
To create a 2D math plot:
- Add one or more line or function plots to an existing graph.
- Select the graph or any part of the graph.
- Click the Graph Tools | Add to Graph | Math Plot command. The math plot is created in the graph using the default properties.
Editing Math Plot Properties
On initial creation, all line and function plots within the graph are used to create the math plot. To change the features of a math plot, including the plots and equation used to create it, first select the math plot in the plot window or Object Manager and then edit its properties in theProperty Manager.
Click the following tabs in the Property Manager to change different properties: