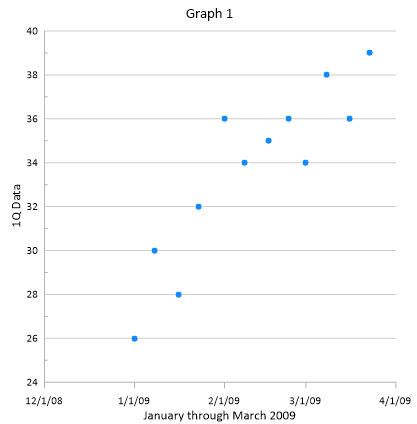
Changing the X Axis Date/Time Tick Mark Spacing
Tick marks can be spaced at any desired interval. Tick marks can be changed to show one tick mark every X number of units or can be based on date/time units, such as minutes, days, months, or years. To set the tick marks to display one tick and label per month:
-
Click on the X Axis 1 in the Object Manager to select it.
-
In the Property Manager, click on the Ticks tab to display the tick mark properties.
-
Click the
 to the left of the Major Ticks
section to expand the major tick options, if necessary.
 -
Check the box next to the Use date/time spacing option in the Major Ticks section.
-
Next to Date/time spacing, click Every Year to open the Date/Time Spacing dialog.
-
Change Year to Month and click OK.
The X Axis major tick marks are now displayed at 1/1/09, 2/1/09, 3/1/09, and 4/1/09.
|
|
|
The X Axis tick mark spacing can be based on date/time units. |
Back to Creating a Line/Scatter Plot
