Calculating Statistics on the Data
Sometimes, it is necessary to know some basic statistical information about the data. For instance, what is the maximum value for each site and how do the average values relate to one another? This information can be calculated in the worksheet. To compare multiple site average values and compare confidence in the values, we could click on each column separately or we could display all of the information at once. To display all of the information at once:
|
|
|
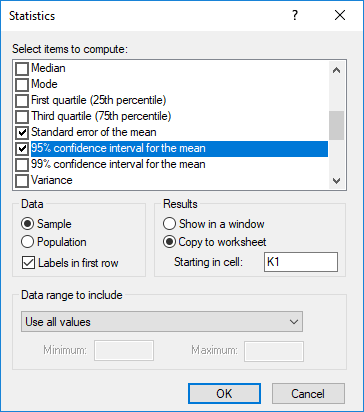
Check desired options and select Copy to worksheet to copy the results to the existing worksheet. |
-
Click on the header B and hold down the left mouse button. Drag the mouse across all column headers between column B and column I, and then release the mouse button. All Site columns are now selected.
-
Click the Data Tools | Data | Statistics command.
-
In the Statistics dialog, select the items that should be displayed. In this case, we are interested in the maximum value, average values, standard deviation, and confidence in the average values. From the Select items to compute list, select:
- Maximum
- Mean
- Standard error of the mean
- Standard Deviation
- 95% confidence interval for the mean
-
Select Copy to worksheet and set the Starting in cell to K1 to display the summary information in the same worksheet as the actual data instead of in a report window.
-
Click OK and the statistics are displayed in columns K through S.
Mean values can be compared visually. The standard error of the mean and 95% confidence value can also be compared. In addition, plots can be created directly from the summary statistics information, if desired.

Visually inspect the statistical results to compare various site data.
Back to Editing Data
Next to Saving a Data File
