Box Plot Data
Box plot data should be in columns for each category. In the example graph shown below, Test 1, Test 2, Test 3, and Test 4 are the four categories. Box plots are ideal for making comparisons between data sets such as these.
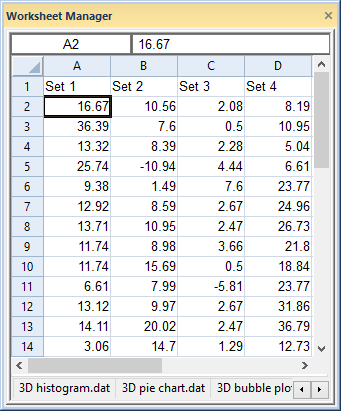
This sample data set displays four categories.
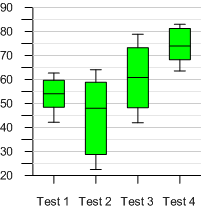
Each column of data is plotted
as a box and whiskers.